Alerts Management
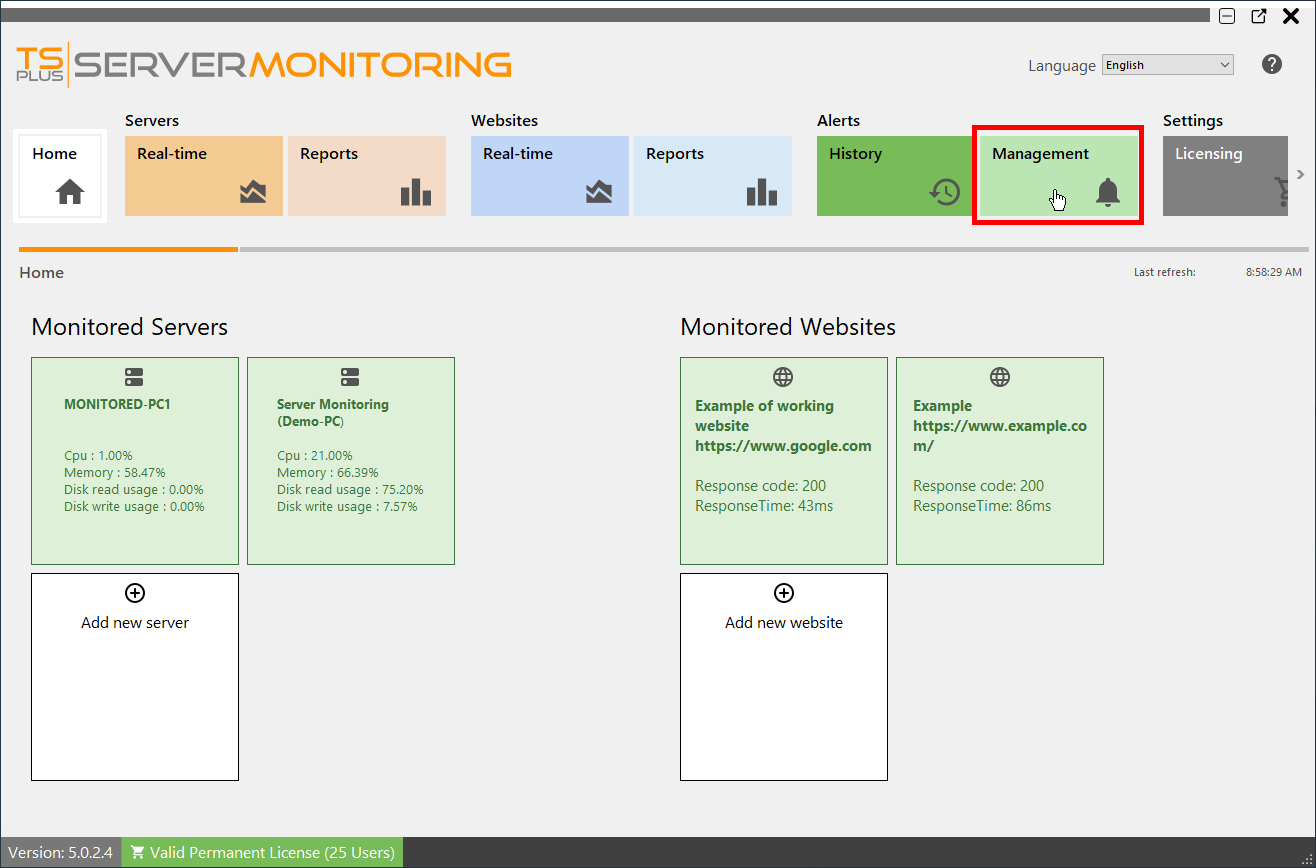
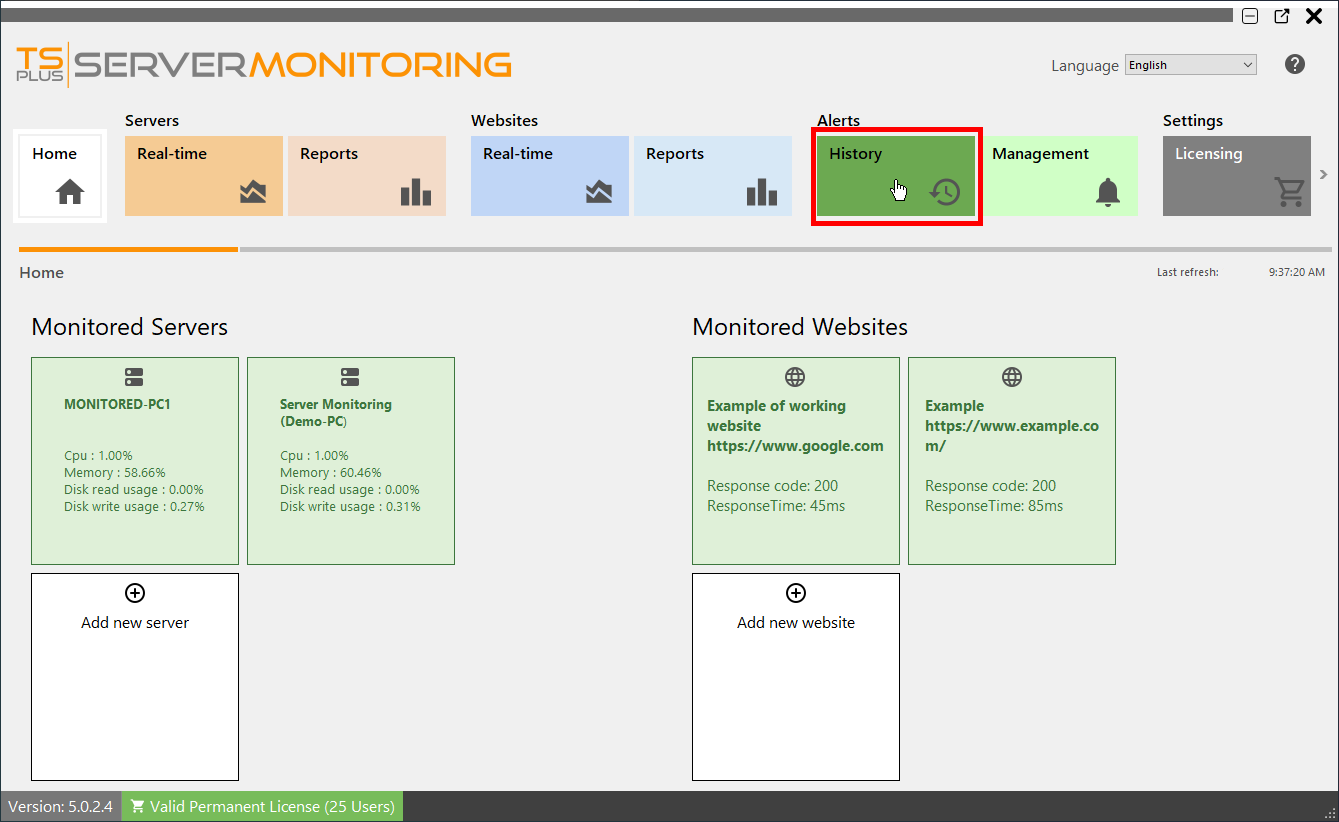
You can access Alerts Management by clicking on the Management tile of Alerts section on the home page:
When you install an agent on a server to monitor, Server Monitoring will automatically create basic alerts for the server. Creating a new website will also create alerts for the website.
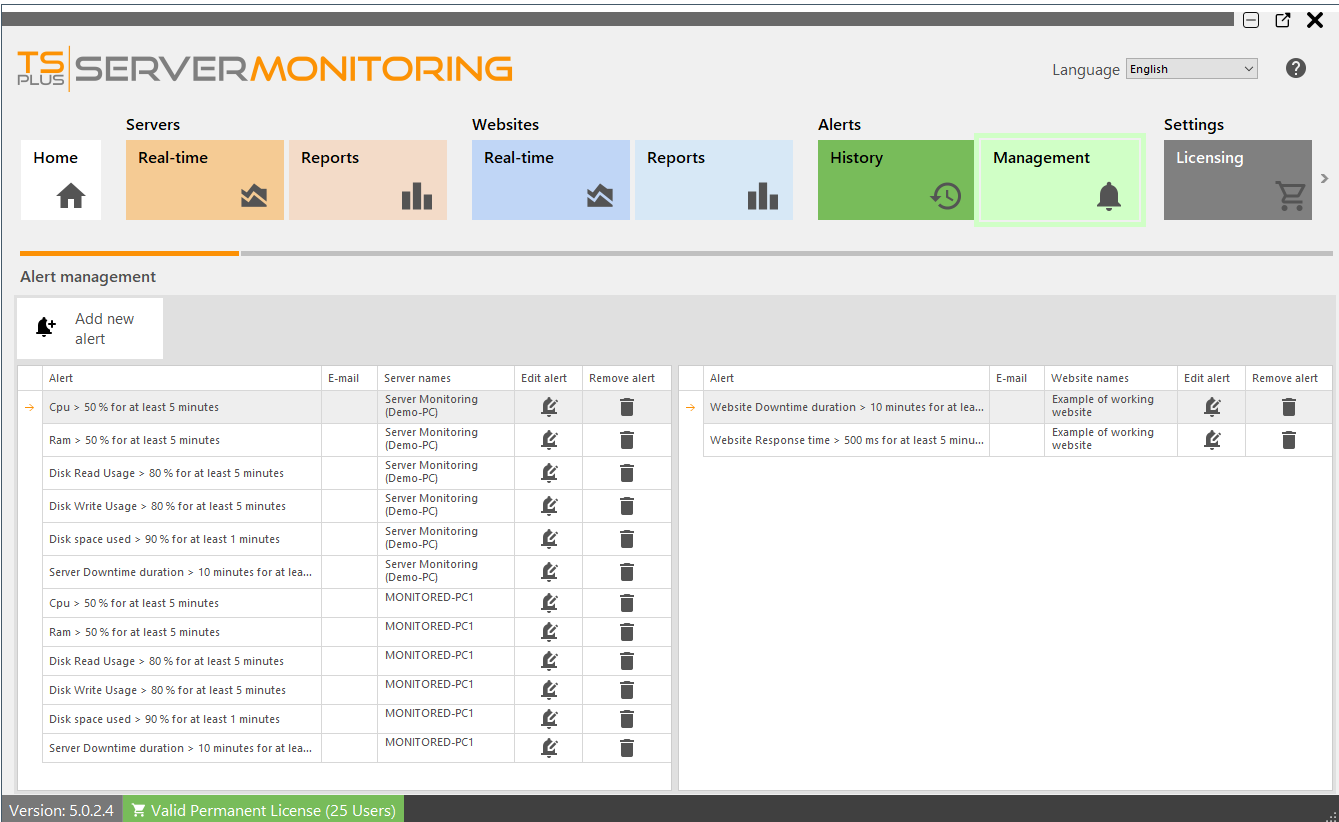
Using the "Add new Alert" button, you can add alerts on your Server Monitoring system.
For servers, alerts can be set for:
- Processor
- Memory
- Disk read/write usage
- Network usage (bytes sent/received)
- Disk used space
- Active Users
- Downtime Duration
For websites, alerts can be set for Response Time or Downtime Duration.
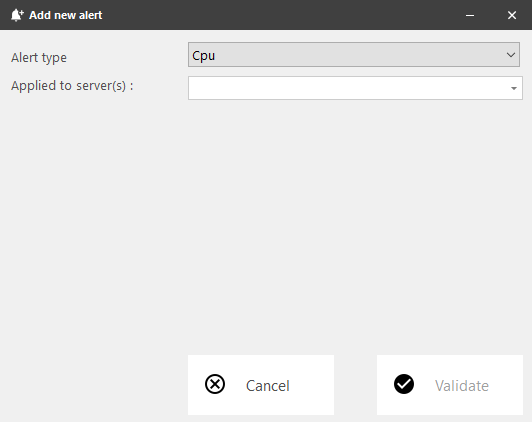
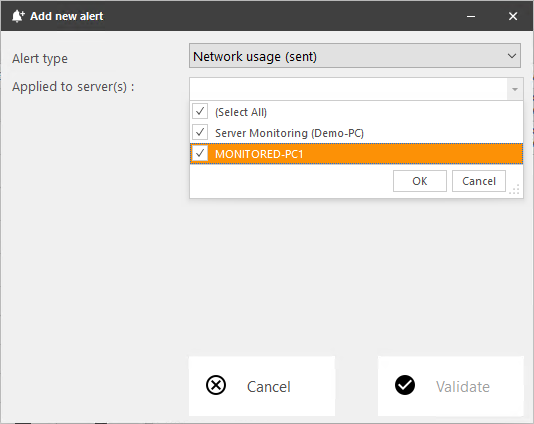
Please select the type of alert you want to create, and the server(s) or website(s) you want to monitor.
Then you can set the alert's parameters :
You can customize the settings with your own values:
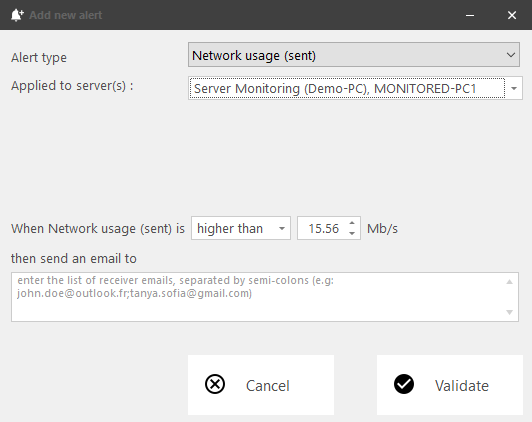
You can add multiple adresses for alerts to be sent to. If this field is left empty, alerts will still be visible in the alert history of Server Monitoring.
You can also edit or delete an alert, by clicking on the Edit or Remove buttons.
Notifications
Once you have configured an alert on your server or website, Server Monitoring will closely monitor the chosen metric and send you an email as soon as the targeted threshold is reached or exceeded. Server Monitoring will also send you an email when that metric is back to normal.
You can check historic alerts by clicking on the History tile of Alerts section on the home page.
You will see a list of alerts triggered, with the title of the alert, the server or website monitored, the beginning of the alert, and its end (if empty, the alert is still triggered).
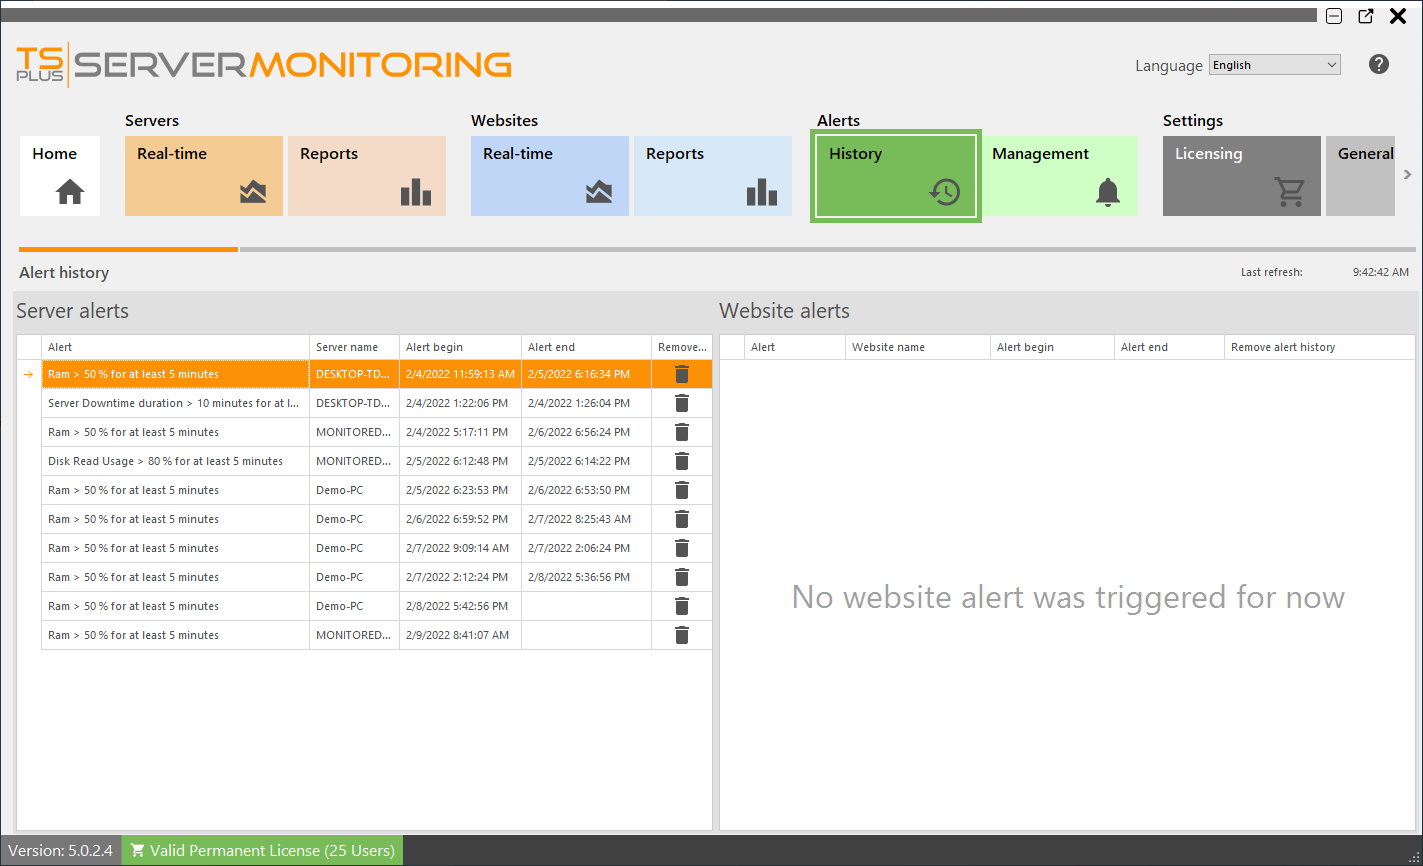
You can delete one or more lines of history by clicking on the Remove button.