Website Report features
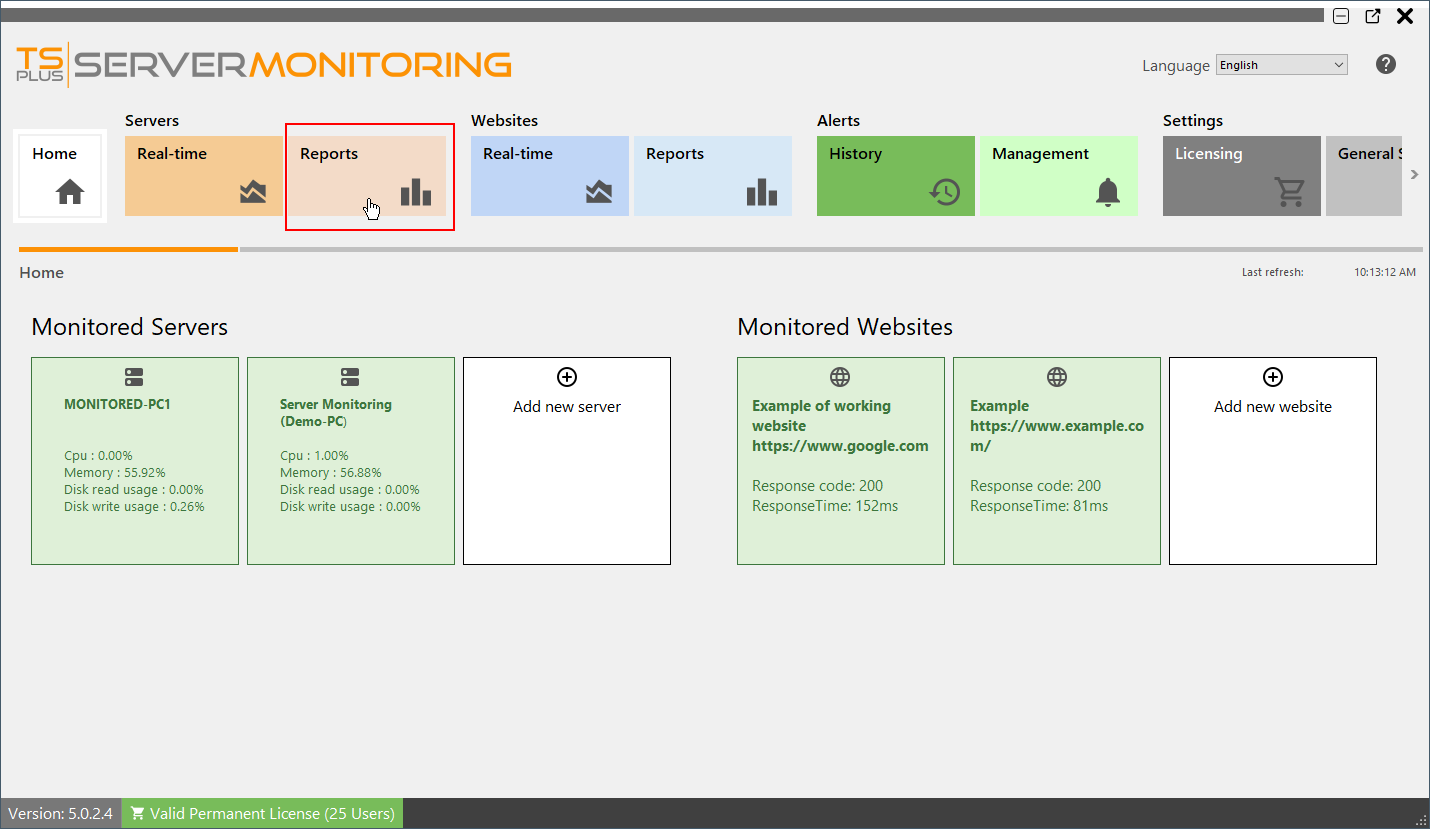
To access the reporting feature for monitored websites, click on the "Reports" tile in Websites section:
You will see this screen:
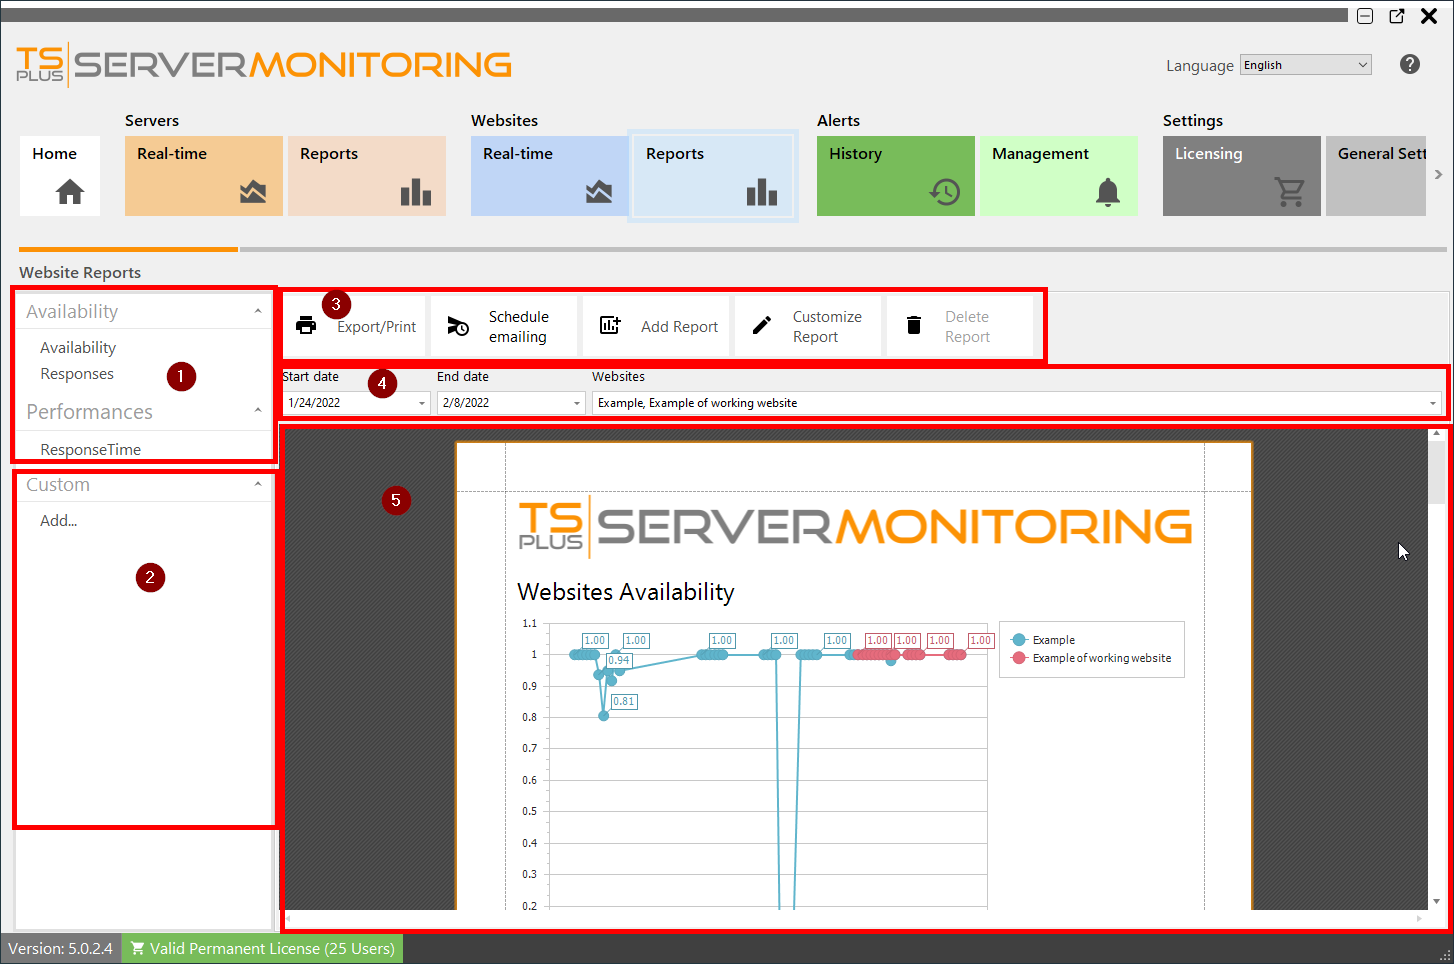
You can see 5 different areas:
- Standard reports: This is a list of standard reports provided by default with the installation of Server Monitoring. You can click on any of them to see the report.
- Custom reports: Here you can create your own reports, by adding new columns to the report, custom images etc. The report list is displayed here and you can click on any of them to see the report.
- Actions on reports: You can export/print reports, customize them, schedule emailing or delete them.
- Filters: Here you can filter the reports by website and by date.
- Report preview: Preview the report currently selected.
To learn more about Server Monitoring reports, please read this documentation.
NOTE: The procedure is the same for server reports and website reports.